使用 Istio 进行监控
监控对于支持向微服务架构风格的转变至关重要。
使用 Istio,您可以默认获得微服务之间流量的监控。您可以使用 Istio 仪表盘实时监控您的微服务。
Istio 与 Prometheus 时间序列数据库和监控系统 开箱即用地集成。Prometheus 收集各种与流量相关的指标,并提供 丰富的查询语言 来处理它们。
请参阅以下几个 Prometheus 与 Istio 相关的查询示例。
通过 http://my-istio-logs-database.io 访问 Prometheus UI。(
my-istio-logs-database.ioURL 应该在您的 /etc/hosts 文件中,您之前已设置它 设置过)。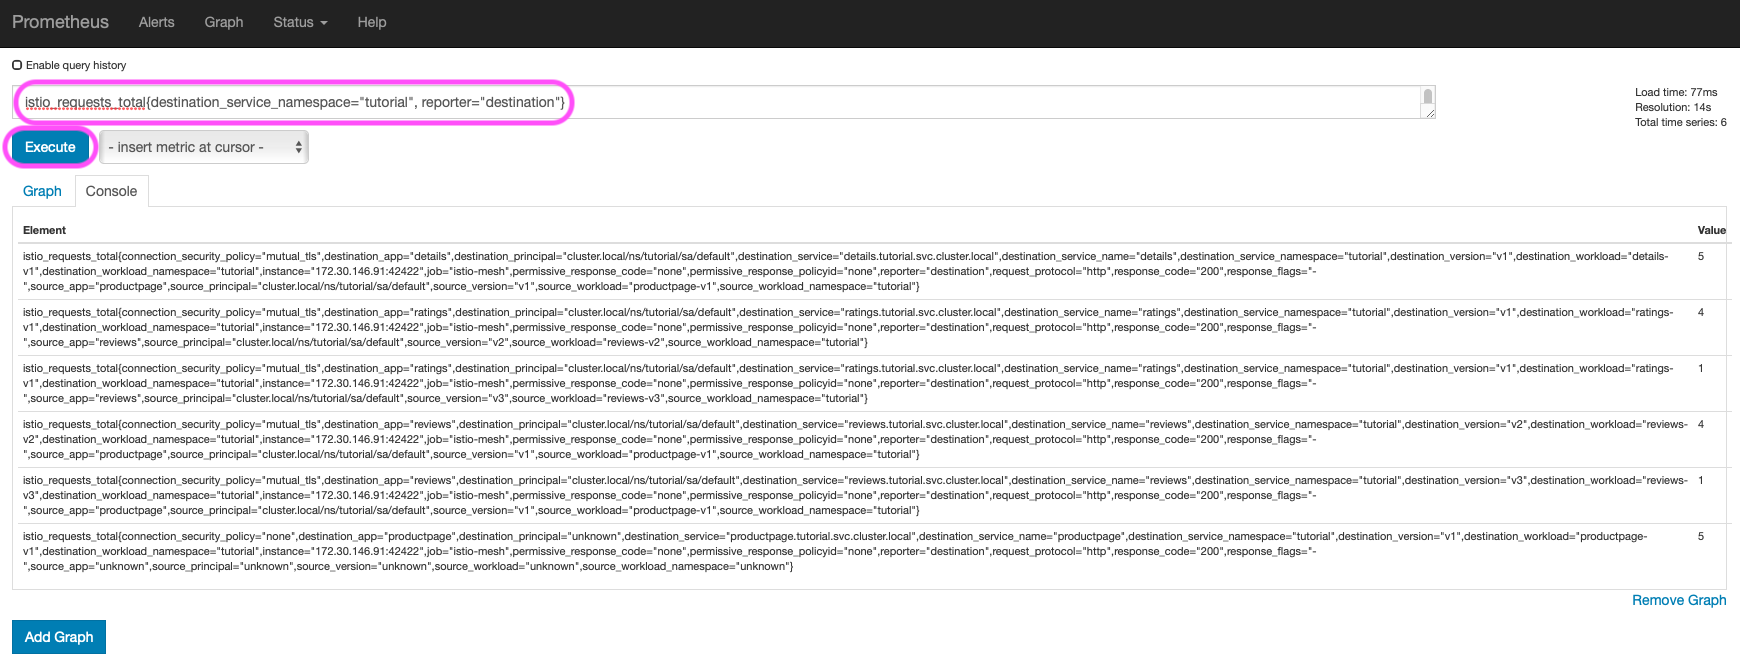
Prometheus 查询 UI 在“表达式”输入框中运行以下示例查询。按下“执行”按钮,在“控制台”选项卡中查看查询结果。查询使用
tutorial作为应用程序命名空间的名称,请将其替换为您的命名空间的名称。为了获得最佳结果,在查询数据时,请运行前面步骤中描述的实时流量模拟器。获取您命名空间中的所有请求
istio_requests_total{destination_service_namespace="tutorial", reporter="destination"}获取您命名空间中所有请求的总和
sum(istio_requests_total{destination_service_namespace="tutorial", reporter="destination"})获取对
reviews微服务的请求istio_requests_total{destination_service_namespace="tutorial", reporter="destination",destination_service_name="reviews"}速率 在过去 5 分钟内对
reviews微服务的所有实例的请求rate(istio_requests_total{destination_service_namespace="tutorial", reporter="destination",destination_service_name="reviews"}[5m])
上面的查询使用 istio_requests_total 指标,这是一个标准的 Istio 指标。您可以观察其他指标,特别是 Envoy (Envoy 是 Istio 的边车代理) 的指标。您可以在“在光标处插入指标”下拉菜单中查看收集的指标。
下一步
恭喜您完成教程!
这些任务非常适合初学者使用此 demo 安装进一步评估 Istio 的功能
在您将 Istio 自定义用于生产环境之前,请参阅以下资源
加入 Istio 社区
欢迎您通过加入 Istio 社区 来提出问题并提供反馈。