从 Prometheus 查询指标
本任务将向您展示如何使用 Prometheus 查询 Istio 指标。作为本任务的一部分,您将使用基于 Web 的界面来查询指标值。
本任务中将使用 Bookinfo 示例应用程序作为示例应用程序。
开始之前
- 在您的集群中 安装 Istio。
- 安装 Prometheus 附加组件。
- 部署 Bookinfo 应用程序。
查询 Istio 指标
验证
prometheus服务是否在您的集群中运行。在 Kubernetes 环境中,执行以下命令
$ kubectl -n istio-system get svc prometheus
NAME         TYPE        CLUSTER-IP       EXTERNAL-IP   PORT(S)    AGE
prometheus   ClusterIP   10.109.160.254   <none>        9090/TCP   4m
向网格发送流量。
对于 Bookinfo 示例,请在您的 Web 浏览器中访问
http://$GATEWAY_URL/productpage或执行以下命令$ curl "http://$GATEWAY_URL/productpage"打开 Prometheus UI。
在 Kubernetes 环境中,执行以下命令
$ istioctl dashboard prometheus单击标题中 Prometheus 右侧的图表。
执行 Prometheus 查询。
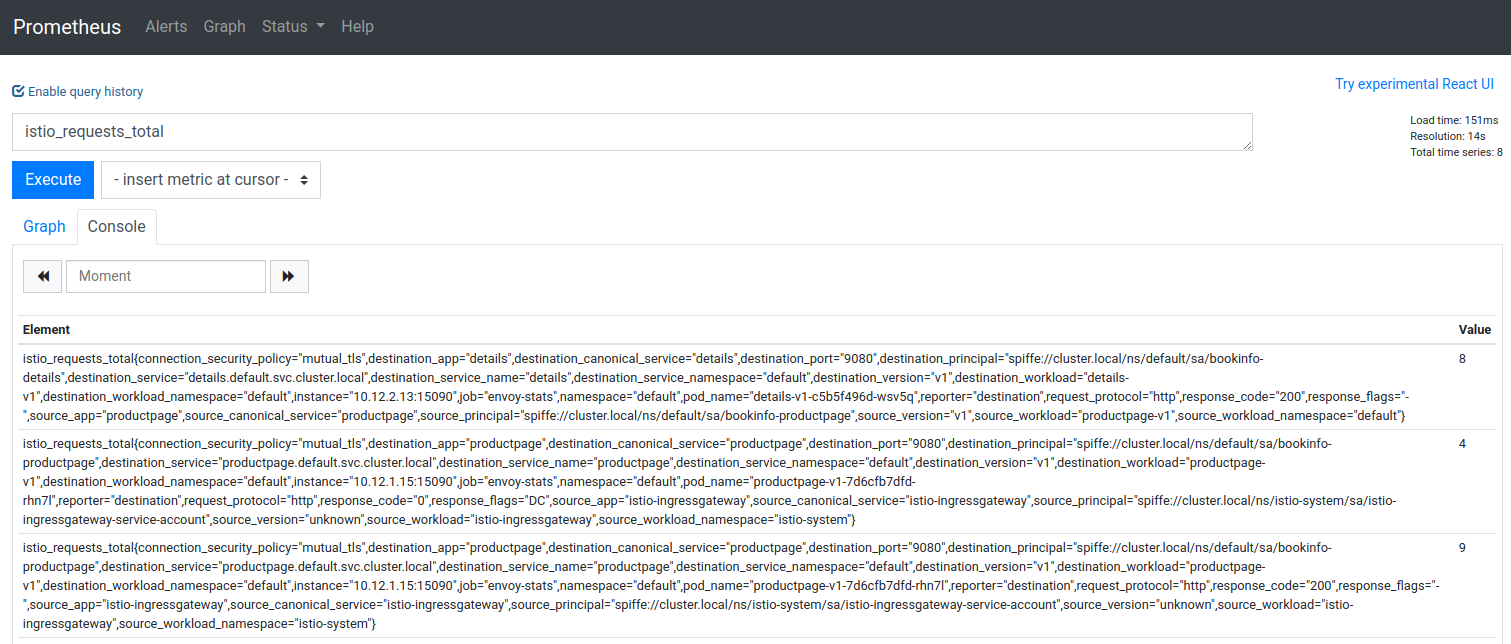
在网页顶部的“表达式”输入框中,输入以下文本
istio_requests_total然后,单击执行按钮。
结果将类似于
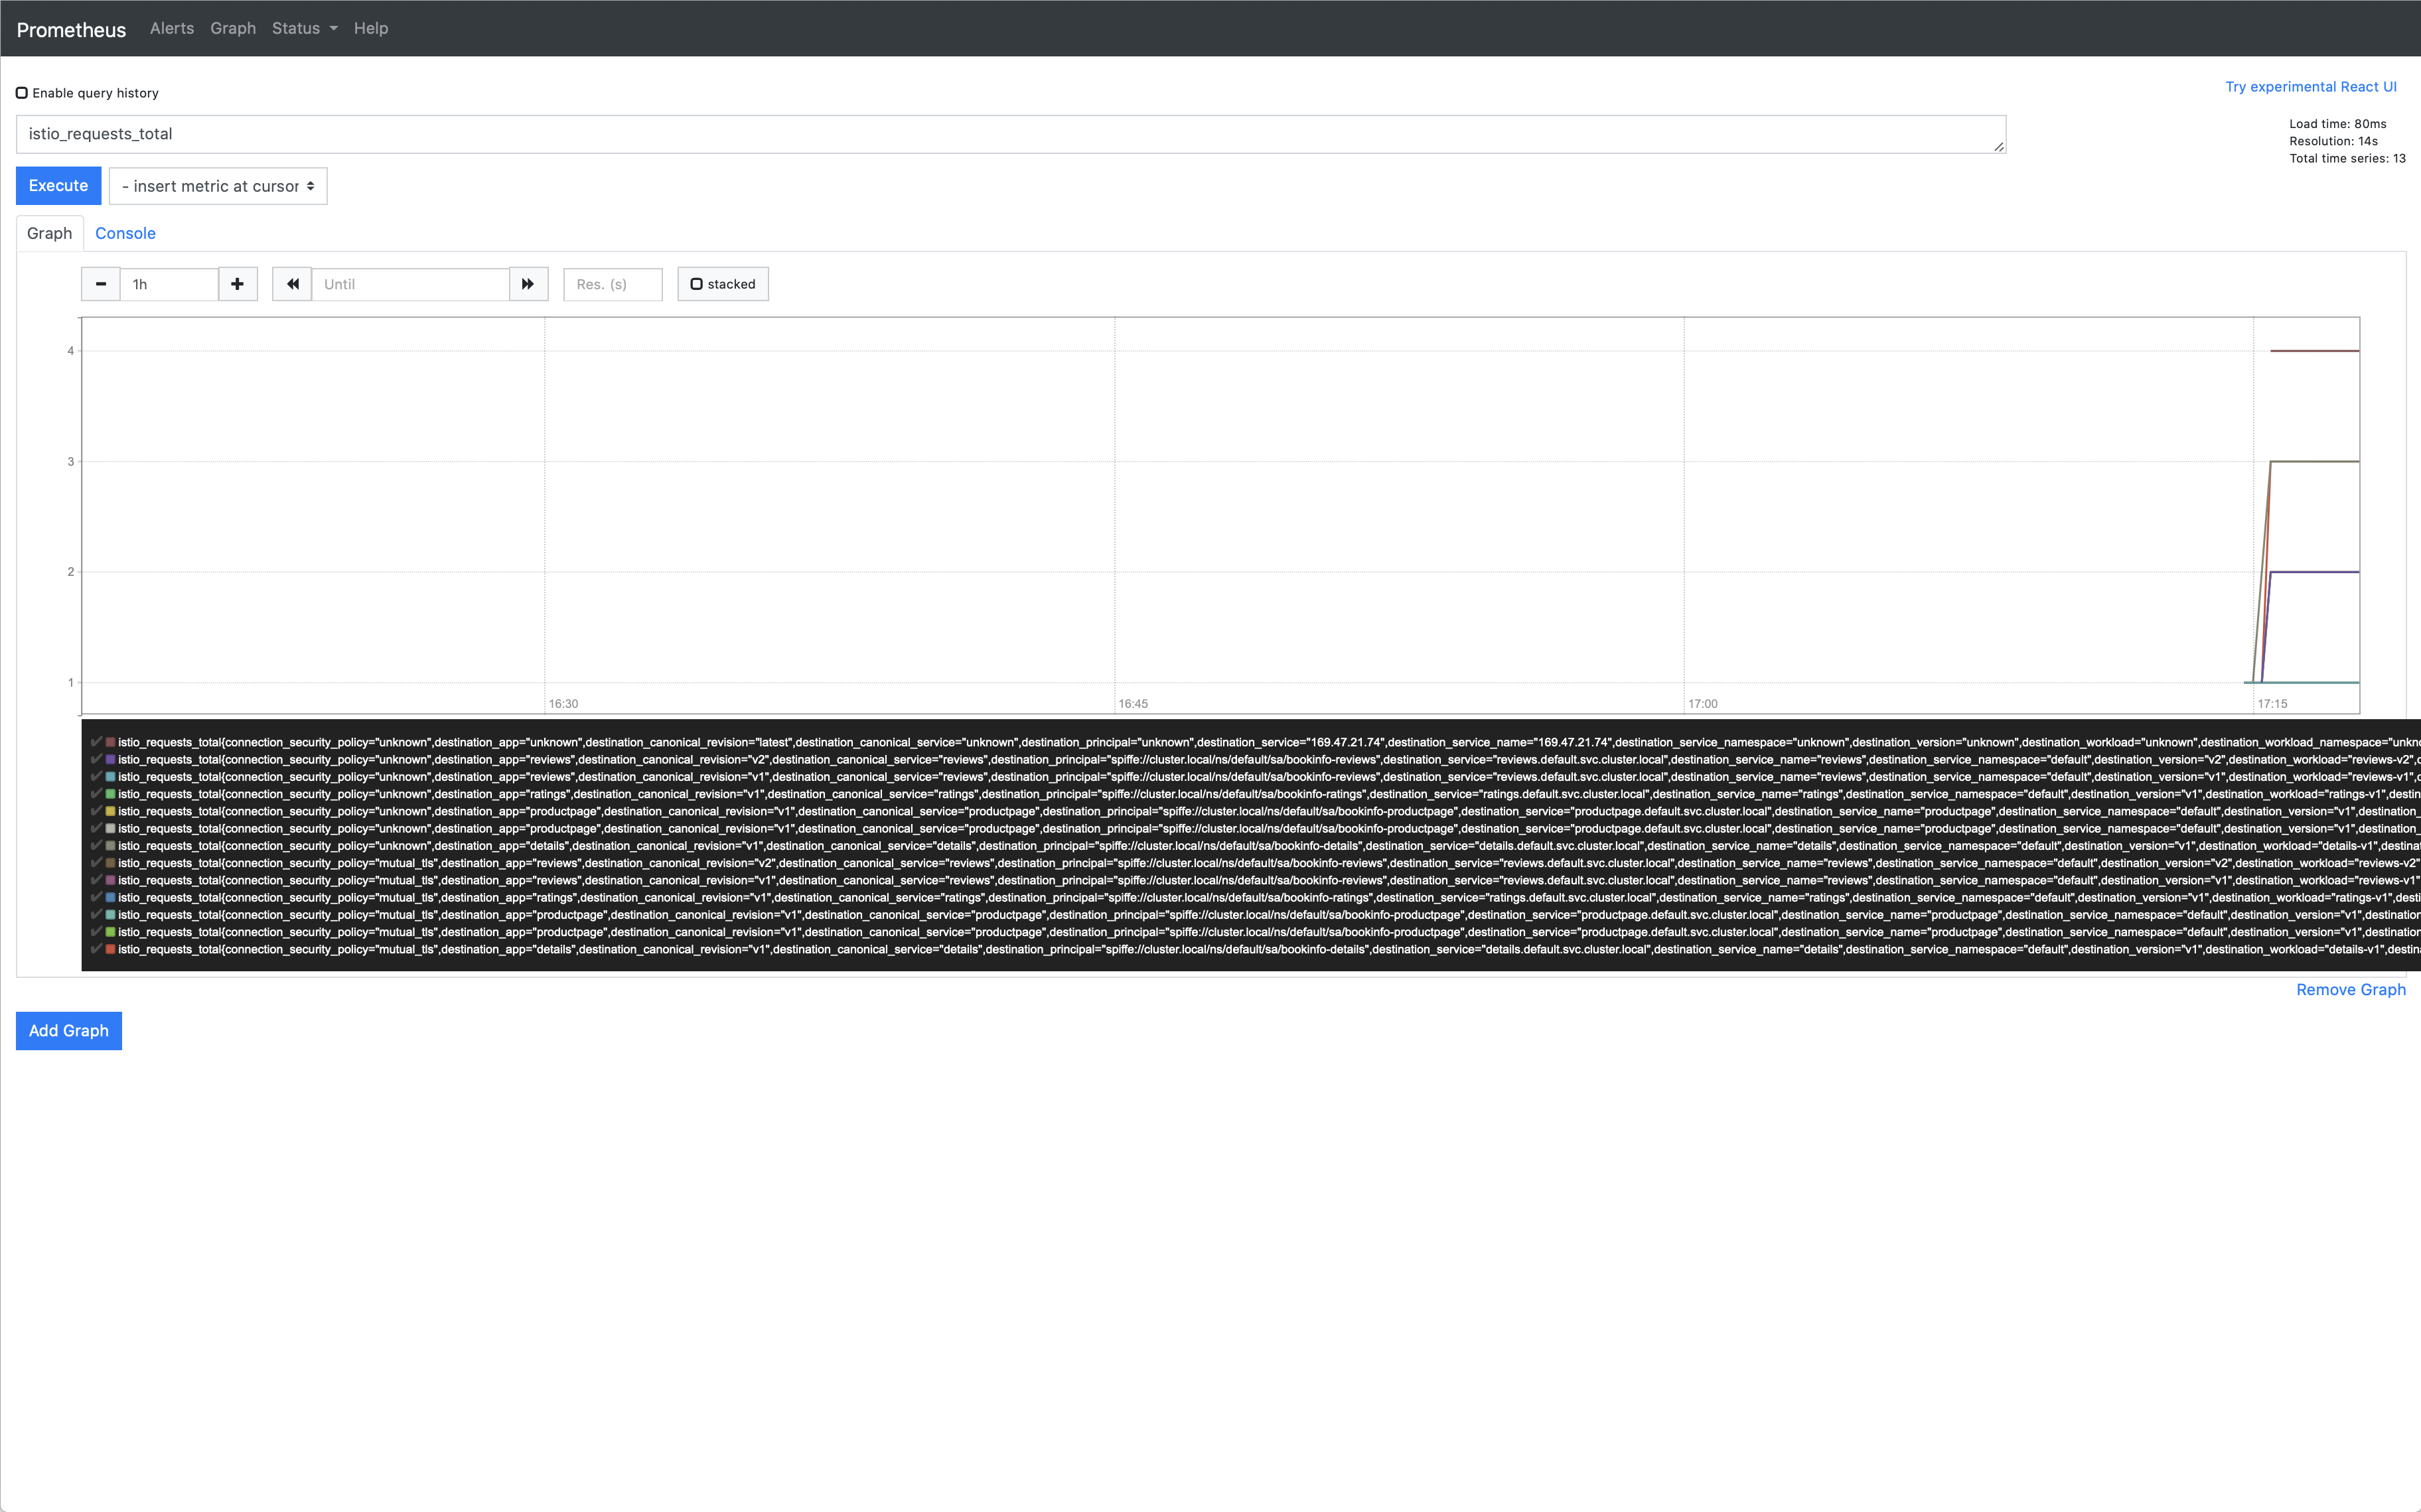
您还可以通过选择执行按钮下方的图表选项卡以图形方式查看查询结果。
其他可尝试的查询
对
productpage服务的所有请求的总数istio_requests_total{destination_service="productpage.default.svc.cluster.local"}对
reviews服务的v3版本的所有请求的总数istio_requests_total{destination_service="reviews.default.svc.cluster.local", destination_version="v3"}此查询返回对
reviews服务的 v3 版本的所有请求的当前总数。过去 5 分钟内对
productpage服务的所有实例的请求速率rate(istio_requests_total{destination_service=~"productpage.*", response_code="200"}[5m])
关于 Prometheus 插件
Prometheus 附加组件是一个预先配置为抓取 Istio 端点以收集指标的 Prometheus 服务器。它提供了一种持久存储和查询 Istio 指标的机制。
有关 Prometheus 查询的更多信息,请阅读其 查询文档。
清理
使用 control-C 或以下命令删除任何可能仍在运行的
istioctl进程:$ killall istioctl如果您不打算探索任何后续任务,请参阅 Bookinfo 清理 说明以关闭应用程序。